- In our base case, we assume that current social distancing efforts will begin to reduce the number of cases by the end of May and we will be able to begin lifting restrictions in June and July.
- Additional waves of the virus and social distancing measures are expected in the second half of the year, but not at current levels given the future availability of treatments.
- We anticipate waves of drug treatments for COVID-19: Gilead’s remdesivir in the summer, targeted antibodies by the end of the year, and ultimately a vaccine in 2021.
- We forecast a 2.9% contraction in U.S. GDP in 2020, but anticipate that the scope of the shutdown to disrupt the economy in the long term is likely overrated. About 70% of GDP is from businesses that are exempt from orders, and about half of the businesses that aren’t exempt can continue with remote operations. Additionally, the fiscal stimulus should prevent a collapse in demand.
In our first deep dive into the coronavirus, we discussed the potential duration and severity of impact on health and the economy at a higher level, with background on the disease characteristics as well as the burgeoning pipeline of vaccines and treatments. In this update, we dive further into the U.S.’ mitigation strategies on a monthly basis for the remainder of 2020, with updated assumptions on severity and spread, as well as how lessons from other countries can be adapted in the U.S. We also provide analysis of recent data for drug treatments and updates on the status of the most promising programs.
In our base-case scenario, we assume full implementation of aggressive social distancing measures (including closures of schools and nonessential businesses) through most of the second quarter. After that, we think these measures will recede along with the first wave of the outbreak. Secondary waves of the virus are likely in 2020, but they should be much less deadly, thanks largely to new drug treatments. The key driver of our bear-case scenario is inefficacy of new treatments. While a few countries like South Korea and Singapore appear to have brought the virus under control using aggressive but not economically destructive nonpharmaceutical methods, we believe this may be beyond the U.S.’ ability.
We now forecast U.S. real GDP growth of negative 2.9% in 2020 (after deducting a COVID-19 impact of 5%). For global GDP, we expect a decline of 1.4%, implying a recession on par with 2008-09. Our U.S. forecast is based on our detailed scenarios as we project the industry-level impact of mitigation strategies. We think the scope of shutdown orders to disrupt the U.S. economy is probably overrated, as large swaths of the U.S. economy are exempt from the orders. Meanwhile, historically large fiscal stimulus should prevent a collapse in the demand side of the economy.
Overall, we still expect a modest long-run economic impact, with GDP down 0.9%. This is much less than what is implied by the 20%-plus drop in global equities since February. In our view, a COVID-19 recession doesn’t fit the mold of a 2008-style recession with longer-lasting economic impact.

Morningstar’s Analysis: Epidemiology and Society’s Response
With roughly 120,000 Americans diagnosed with COVID-19 by March 28, up from 25,000 as of March 21 and only 70 at the start of the month, the U.S. is now seeing thousands of new diagnoses each day, and many more are probably infected but undiagnosed. Washington was the first state to report a case in January and has been hit hard, although New York and California are also seeing rapid increases in cases and other states could be just days behind their trajectory. For its COVID-19 pandemic preparations, the U.S. government now assumes a pandemic of 18 months with multiple waves, and President Donald Trump has extended the expiration of national social distancing guidelines (avoid nonessential travel, restaurants, and gatherings of 10 or more) from 15 days (through March 30) to 45 days (through April 30). Given the grim statistics, many states have moved rapidly to enforce aggressive mitigation efforts well beyond what we initially envisioned as part of our initial report. We have moved from containment efforts to community mitigation and suppression of current outbreaks, which includes canceling public gatherings and closing schools for most of the U.S. by mid-March. However, many parts of the country are also working from home, and some are closing nonessential businesses. Many states are activating crisis standards at hospitals in another effort to slow the spread of the disease and reduce the peak number of cases which, without such steps, would overwhelm our healthcare system.
We think that the percentage of Americans who will be infected with this first wave of the virus will be relatively low by pandemic standards, at 5%, due to aggressive social distancing measures, and that this wave will last roughly three months. We do expect waves of outbreaks in our base case, not because of weather patterns but because of waves of mitigation efforts that will be applied and relaxed as authorities fine-tune their efforts to contain the disease while minimizing the economic disruption. We think more moderate restrictions during a second wave, when potential treatments as well as diagnostics could be more widely available, could mean an additional 0%-25% of the population infected during that time across our scenarios, beginning when students return to school in September. In all scenarios, we assume that the health impact of the coronavirus in 2021 will be minimal, either due to an effective vaccine or eradication of the virus.
Base Case: Three-Month Broad Shutdown, More Moderate Second-Wave Shutdown
In our base case, we assume that the first wave dies out as aggressive mitigation measures spread to all states over the coming weeks, and that the strictest social distancing and economic lockdown levels remain in place for most of the country for April and May. Specific decisions are typically made at the state level, but sometimes by municipality, and Trump has indicated we will have guidelines for risk categorization at the state and local level using diagnostic data, which fits with our model.
We also assume that pipeline and diagnostic progress by June offers the reassurance the government and society need to begin to reopen schools and businesses over the summer, although we do expect more Americans to be infected during a second potentially three-month wave beginning at the start of school, taking us roughly to the end of 2020. Assuming at least one drug treatment option and strong diagnostic testing capacity by the second wave, patients should be diagnosed rapidly upon having symptoms, and a treatment should be available to reduce the course and severity of the illness. Therefore, we think mitigation measures will be more moderate and easier to initiate and maintain as necessary. However, they could vary across geographies depending on state policies, hospital systems, and demographics.
We still assume 20% of the population is infected over the course of the year in our base case, with a slightly higher average death rate of 0.4% (up from 0.3% in our previous analysis). As compared with an analysis by Emanuel et al. in the New England Journal of Medicine, this 20% infection rate could roughly correspond to social distancing reducing infections by 75% (from the 80% infection rates predicted with no social distancing by the Imperial College COVID-19 Response Team).
For our assumed death rate, we turn to statistics from South Korea. Because South Korea was so aggressive with diagnostics, its testing rate is likely much more relevant for actual fatality rates. The country has seen a 0.84% fatality rate, according to recent data. Extrapolating that to the U.S. (based on death rates by age group) would lead to a roughly 0.89% death rate.
We assume a slightly higher death rate than this analysis implies, around 1% for the first wave hit in the U.S., assuming hospitals are less prepared, standards of care are still being developed, and less availability of ventilators and drug therapies. We also assume that diagnosis rates lag significantly at the start, with only 10% of cases diagnosed in March. This is based partly on an analysis estimating that only 1 in 7 cases were diagnosed in China in January, as well as an analysis by Columbia estimating that 1 in 11 infections in the U.S. were reported through March 13.
Even though we expect mitigation measures to begin to have a positive (but lagging) effect in the coming weeks, we assume there will be ventilator shortages in some states in April. We assume the slow spread of aggressive mitigation measures in March as well as the somewhat noncompliant American population will still lead to even higher infection rates in April and May as the virus rolls through different states. We assume a roughly 0.1% death rate during the second, larger wave, around the level of seasonal flu, due to treatments and quick diagnosis. We still assume that a vaccine is not relevant for trajectory of the disease in 2020, but that it will come into play during an expected coronavirus recurrence in 2021.

The question of whether we have enough hospital beds or ventilators to handle the surge in demand, particularly at the level of the intensive-care unit, has been an open one, with some alarming analysis so far. We have almost a million hospital beds in the U.S. but only roughly 100,000 ICU-level beds, and many of these were already in use at the start of the pandemic. Ventilators, which are required by many patients who end up in the ICU, are also in short supply, as are the nurses and respiratory therapists who monitor patients on ventilators. There are roughly 170,000 ventilators in the U.S., and ventilator manufacturers like Hamilton, Draegerwerk, and Getinge are used to producing roughly 10,000 ventilators a year for global use; doubling capacity is probably the best we can hope for in the coming months. In addition, there are only enough nurses and therapists to monitor roughly 100,000-135,000 patients at once.
One estimate published in Health Affairs, assuming 40% of the population is infected and 50% of occupied beds could be freed for COVID-19 patients, concluded that we need to spread infections over an 18-month period in order to prevent being far beyond our capacity (12 months, assuming a 20% infection rate). These numbers assumed that roughly 5% of COVID-19 patients require the ICU. We think this analysis does not account for the aggressive measures the U.S. is currently taking and assumes far higher infection rates than any of our scenarios during a first wave, when severity (and ventilator need) should be the highest.
We think ventilator shortages will be limited in our base and bull cases but could run for several months in a bear-case scenario. Making the simplifying assumption that most patients need a ventilator for a month (many need ventilators for several weeks, other for a matter of days), we think shortages will be short-lived (March-April) as outbreaks during this first wave create local shortages in our base and bull cases, and that ventilator needs should average out below our capacity. In our bear case, we assume need outstrips demand for roughly four of the seven months of a single, larger wave.
Our analysis does not account for more creative ways to boost supply, so shortages could be more short-lived. In response to this crisis, manufacturers like General Motors, Dyson, and Tesla are also expected to produce low-end ventilators to help meet demand. However, we think the most important update is the Food and Drug Administration’s emergency use authorization on March 24 that allowed the use of other breathing machines and tools as ventilators, including anesthesia gas hardware, sleep apnea machines, and COPD portable oxygen generators. It also allowed the use of air tube splitters, which means that patients can share ventilators.
Bull Case: Successful Containment and Surveillance, Business Largely Reopens in June
Our prior bull case, with only a 0.1% death rate for those infected, is looking overly optimistic, so we are increasing the death rate to 1.1% in this scenario, higher than our base case. This appears counterintuitive but assumes a higher concentration of cases during the first wave (which has a higher death rate in both scenarios) than the second wave (lower death rate in both scenarios). We also assume only 5% of the population is infected, down from 10% in our earlier analysis, corresponding to a potential 95% reduction in infection rates from social distancing. This would be similar to estimated infection rates in Wuhan, China, due to the effectiveness of social distancing, assuming 10 times more people were infected than reported. The second wave of the disease would only have minimal spread due to the wide use of diagnostics and contact tracing from confirmed infected to find other potential exposed or infected individuals using surveillance (perhaps with cellphone data and new apps that have been developed for this purpose). This assumes the U.S. could mimic the tactics used successfully in Singapore and South Korea, if given a second chance after an initial containment of a first wave (which is requiring aggressive widespread lockdowns, similar to China but less extreme). Businesses and schools would largely be reopened after the first wave, with perhaps some limited business closures in certain municipalities that have outbreaks. Similar to our base case, we assume treatments become available by mid-2020, but surveillance creates less of a need for them. We still assume prophylaxes (vaccines and antibodies) see wider use in 2021.

Bear Case: Longer Economic Shutdown, Late Mitigation, Lack of Pipeline Progress
In our bear case, we assume that the recent shutdown of nonessential services in the hardest-hit areas is not enough to contain a highly contagious virus, due to late and nonuniform implementation across all states (against the recommendation of Anthony S. Fauci, chief medical advisor to the White House coronavirus task force) of the most aggressive measures like stay-at-home orders, as well as the public’s hesitance to comply with recommendations at the start of the outbreak, particularly in regions that are hit later (central states). In this scenario, cases would overwhelm our healthcare system without an effective treatment. Letting go of the brakes would be a slow process that would take us through the end of the year. We continue to assume a higher spread of infections (30% of the population), but we have increased our assumed death rate to 1.9% (from 0.7%) in this scenario, due to higher death rates than we initially expected, even in geographies with higher diagnosis rates like South Korea, as well as our assumption that care would be suboptimal in this scenario, with significant ventilator shortages for several months across the country. We assume that rather than two waves, the disease takes the path of one extended larger wave.
There is a silver lining to higher infection rates: a higher number of people emerging from infection with antibodies to the virus. These recovered patients can help restart the economy, even if there is no effective treatment or vaccine. In fact, Germany expects to issue immunity certificates to those who have developed antibodies (which can be determined with a blood test). This could inform the timing and order of removing the various parts of that country’s lockdown.

Lessons on Suppressing and Mitigating a Pandemic
Faced with a pandemic, the Imperial College COVID-19 Response Team outlined potential responses that governments can take to improve outcomes. Two basic strategies include mitigation (reducing impact and protecting high-risk individuals) and suppression (reversing growth and maintaining low-level infection rates). The writers noted that any interventions would probably need two to three weeks until the effect becomes noticeable in ICU cases and death rates, given the way the disease progresses. In a March 26 update, the authors clarified that suppression measures would be ideally paired with high levels of diagnostic testing and surveillance as well as rapid isolation of cases to avoid resurgence. They also discussed the idea of early implementation for suppression strategies (at 0.2 death per 100,000 population per week) leading to maximum reductions in death rates. The U.S. began more aggressive restrictions around March 16, at a time when the prior week’s deaths were less than 50 (only about 0.015 per 100,000 U.S. population), meaning that maximum suppression should still be possible.
School Closures Help, but Only as Part of Broader Efforts
A U.S. Public Health Service survey during 1919-21 did not show a link between school closures and reduced cases of Spanish flu, as without other measures of social distancing, closures can increase exposure (children expose extended family at home), and supportive data for mitigation strategies is not from controlled studies, lowering conviction in analysis of past outcomes. However, another study of the Spanish flu revealed that variations in layering multiple social distancing measures led to a large range in excess fatalities, from 15 to 249 per 100,000 in various cities. Chicago and many other cities in the U.S. prohibited public gatherings, and San Francisco recommended all residents wear masks. Early action with multiple measures (banning mass gatherings, closing schools, and isolation and quarantine) led to the lowest mortality rates. Therefore, we see school closures as part of a larger mitigation effort. Similarly, the Centers for Disease Control and Prevention has indicated that short school closures very early in an outbreak are not very helpful, and that longer closures (8-20 weeks) further into community spread could be helpful, but only in combination with other mitigation efforts. We also think that while school closures may not have been as necessary in containing spread in Hong Kong--Singapore was successful early without closing schools--the fact that the U.S. is working with a different set of tools (less advanced isolation and surveillance as well as delays in testing have made it difficult to judge the level of community spread in the U.S. to date) may add to the justification of school closures here.
Only Recent Precedent for Extreme Mitigation Is Spanish Flu
The Spanish flu of 1918-19 and Asian flu of 1957-58 were quite different in their severity and in society’s response. With Spanish flu, the severity led to significant mitigation measures in U.S. cities. For example, one analysis of 43 U.S. cities during the second wave of the Spanish flu found that school closures and banning large gatherings were the most common combination (79% of cities), for a median length of 4 weeks but up to 10 weeks total. The analysis found that New York reacted quickly with more than 10 weeks of isolation and quarantine, as well as staggered business hours in October, but did not layer these responses and had relatively high infection and death rates. Pittsburgh fared even worse, with a late (October) decision to ban public gatherings; this initiative was stopped early and followed by school closures at the end of October. St. Louis layered school closures and large gathering bans for 10 weeks and saw a death rate of 0.4% of the population versus double that for Pittsburgh. The authors concluded that layering efforts significantly reduced death rates, especially when action was taken early and repeated if another wave began. In contrast, the 1957 flu pandemic, while widespread, was not as deadly, and the strategy relied on waiting for a vaccine to protect Americans, which came too late to affect the trajectory of the disease.
In 2020 Pandemic, Asia’s Early Success Can Guide the U.S.
Countries that have acted early or aggressively with diagnostics and other mitigation measures like contact tracing (largely in Asia but also Germany) have been able to prevent acceleration in cases and contain the virus. China is slowly emerging from its lockdown, which began Jan. 23 and lasted roughly two months. South Korea was able to avoid the massive lockdowns and cordon sanitaire (armed guards surrounding an infected area) that defined China’s containment of the coronavirus. While the U.S. and most European countries weren’t fast enough with diagnostics to contain the coronavirus from the start, and we still see uncertainty around the viability of contact tracing in many Western countries, the earlier-hit countries also provide examples of valuable tools that could be applied in the U.S., once we’ve contained the virus with broader (and costlier) measures during this first wave.
The success of a country in containing the virus is partly out of its control. Death rates are highly variable for many reasons, but demographics is key. For example, one study noted that the fatality rate in Italy was actually quite similar to China’s up to age 69, but that 38% of Italy’s cases had been in patients older than 70, while only 12% of China’s were from this older, high-risk demographic. This fits with the relative size of the over-65 populations. Also, Italy reduced testing after Feb. 25 to focus on those with severe symptoms, further pushing up fatality rate ratios (smaller denominator). Perhaps by luck, not demographics, Germany’s outbreak is much more centered on a younger population, and its strong diagnostic testing could also be helping to support its much lower death rate. In addition, the composition of a household can vary greatly by country, with twice as many 30- to 49-year-olds living with parents in Italy than in Germany. Multigenerational families facilitate more household spread and lead to a greater likelihood of severe cases (concentrated among older patients).
Rapid Action to Prevent an Outbreak Is Critical
Singapore was one of the first countries to stop flights from Wuhan in January. It developed a response system during the SARS epidemic that has been applied here, involving diagnosis, isolation of infected patients, contact tracing to find others who might have been exposed, and quarantine of these individuals. Information is collected by the government for each confirmed case, with successful tracing results and addresses that are the discovered sources of case clusters published by the Ministry of Health. Among the first 100 patients identified in Singapore, 53% were identified with contact tracing. Singapore is considered the best responder on contact tracing.
South Korea had a large cluster of cases around a massive outbreak in Daegu, but rapid action with diagnostics and contact tracing quickly contained this outbreak. South Korea’s diagnostic testing as a percentage of its population has been unparalleled, with its first case detected on the same day that the U.S. detected its first case. The speed of testing was also extraordinary; by March 9, South Korea had tested 210,000 citizens, or the equivalent of 2.3 million Americans (U.S. testing at that date was below 9,000). Beyond testing, South Korea’s measures have been more aggressive than Singapore’s, as schools and some nonessential businesses were closed. School break was extended further into March, although students in Seoul are expected to return, with some distancing measures and temperature checks, on April 6.
Improved Testing and Contact Tracing Necessary
Testing is a critical piece of preventing further spread and potentially easing the aggressive social distancing that has shut down our economy. Until we improve testing, there is significant uncertainty about the total number of Americans infected with the coronavirus. In addition, without broad diagnostic capacity, isolation, quarantine, and contact tracing all become less useful.
The U.S. began testing at a rate closer to South Korea’s initial rate by the end of March, so we are improving but behind. With capacity to test more than 35,000 patients a day by mid-March in the U.S., we became capable of testing more than 100,000 patients a day by the end of the month, now that we have approved high-throughput tests from firms like Roche, Thermo Fisher, and Abbott as well as testing at commercial labs like LabCorp and Quest. The U.S. tested roughly 1 million Americans in March, and we expect testing rates to grow throughout the year, with hundreds of thousands tested per day.
The FDA has not approved any at-home tests. Everlywell planned to begin supplying at-home tests to consumers starting March 23, initially covering 30,000 patients a week but up to 250,000 a week in the long run; the test is $135 and patients ship the sample to a lab for 48-hour turnaround. However, plans for at-home tests were broadly nixed for now with recent FDA warnings.
While improving diagnostics is one important step, we think contact tracing would be necessary to allow full relaxation of social distancing measures while maintaining containment of the virus. In a best-case scenario, the U.S. can contain the virus by May or June and then apply contact tracing, allowing for a return to business as usual for the most part. However, while contact tracing has been used in several Asian countries with success, Western culture is resistant to the privacy compromise that it involves, and the government having access to our movements would impinge on privacy laws. Firms like Google and Facebook could also share anonymized data, but this could open them up to lawsuits unless the government passes legislation to protect them. Another option is providing an app, such as MIT’s Private Kit, that allows users to anonymously and voluntarily contribute location data. However, some research suggests that more than 70% of contacts need to be traced for this to be effective with an R0 of 2.5, which is similar to estimates for the coronavirus.
Given the high levels of voluntary tracing needed in order to make contact tracing a success in the U.S. and other Western nations, we only assume such a situation in our bull-case scenario (20% probability). Our ability to reduce the number of cases today will depend on aggressive efforts across the country. But over the next several weeks, cases should eventually start to decline, and when new infections fall low enough, our bull case assumes we then begin to follow the rulebook of countries like Singapore and South Korea, with aggressive testing, continued isolation and quarantine, and voluntary contact tracing (surveillance) that allows the general population to return to “normal” and avoid another lockdown.
In a bear case, we assume that we never achieve the level of control needed to implement this, with rolling outbreaks continuing across the country throughout the year (particularly in the absence of a treatment). In a base case, the availability of treatments removes much of the fear of fatality in severe cases, allowing us to return to somewhat more normal behavior despite continued infections; progress with contact tracing is slower and not widespread enough to prevent a second wave but perhaps useful for preventing future outbreaks beyond 2020.
We are closely watching the recent uptick in cases in Hong Kong and Singapore as the countries struggle to manage recently imported cases. South Korea is also preparing to begin to lift restrictions in April. Preventing importation became more challenging as the virus went global, as the initial focus on restricting travel from China shifted to risk from Western countries. Imported cases have led to rising cases and broader measures in some countries, like Singapore’s decision to close bars and reduce gatherings to 10 or fewer beginning March 26 and Hong Kong’s decision to close borders to all nonresidents while maintaining school closures in April. Travel restrictions within a country, particularly one as large as the U.S., could also be necessary, as an outbreak in one city could quickly seed outbreaks in other parts of the country. Overall, we continue to expect that some forms of social distancing--such as fewer large gatherings, more working from home, and less work travel--could become engrained in our society over the next several months, even as stricter measures like business closures and stay-at-home orders are relaxed.
How the Drug Industry Fits In
Beyond nonpharmaceutical interventions like diagnostics, contact tracing, and locking down the economy, another key element in the evolution of this pandemic is potential pharmaceutical interventions, or progress with treatments and prevention.
One important distinction between this pandemic and 20th-century pandemics is treatment. At the time of the Spanish flu, the influenza virus had not even been isolated. In 1957, patients were given a vaccine, but it was too late to have an impact on the trajectory of the disease. In 1999, the first flu treatments, Tamiflu and Relenza, were approved, making it easier for patients to tolerate symptoms but also improving outcomes (Tamiflu can also reduce complications like pneumonia, which can lead to hospitalization and death). In addition, postexposure prophylaxis significantly reduces the chance of getting the flu; in a study of household contacts, seven days of Tamiflu prophylaxis among household members within two days of symptoms of the first infected member reduced confirmed flu cases from 12% in the placebo group to 1% for the Tamiflu group. Such treatments were stockpiled in the 2000s, sparked by avian and swine flu fears.
Best Near-Term Treatment Option Is Still Gilead’s Remdesivir
We think Gilead’s novel antiviral remdesivir has the best shot at efficacy against the coronavirus. Gilead has provided more than 1,000 patients with remdesivir for compassionate use, with others qualifying for clinical trials. The antiviral has been tested in Ebola patients, which offers reassurance on safety, and has shown efficacy in preclinical models in MERS. In addition, there have been initial encouraging stories from use in patients (albeit with no data from controlled studies yet), and the polymerase (the replication machine) of this virus is highly similar to that of SARS; Gilead has positive data in animal models for remdesivir in SARS. The drug is meant to trick the polymerase into thinking that remdesivir is a piece of its genetic code, when it’s really a stop signal that prevents replication and infection.
If ongoing controlled trials read out positively in April, and Gilead is confident in dosage and optimal timing of treatment, the biggest question will become supply. Supply constraints likely mean remdesivir will not have as much of an impact on death rates over the next month or two. However, we do think that such treatments will lower the death rate for a potential second wave this fall. Gilead hasn’t offered specifics, but by its Feb. 4 call for 2019 financial results, it had already begun manufacturing at risk. Gilead is trying to increase supply for trials by making both liquid and freeze-dried forms of the drug, adding more manufacturing partners, and manufacturing the drug in-house. We assume that the firm could have enough supply to treat some severe COVID-19 patients over the next few months and that it would have a broader supply available by the fall, which is part of our base-case scenario that allows less aggressive social distancing to become an acceptable risk.
Repurposed Antiviral, Anti-Inflammatory Drugs Have Mixed Potential
As of late March, various drugs were being repurposed in New York as the state deals with the largest outbreak in the country, with an initial focus on a combination of a malaria drug with antiviral properties (hydroxychloroquine) and an antibiotic (azithromycin). Both drugs have been purchased in large quantities by the state. While New York’s observational study of this regimen has no control arm, it should help us gather more data on the efficacy and safety of such a regimen. Controlled trials are also in progress testing the malaria drug and another variation of it, chloroquine.
The FDA decided to grant emergency use authorization to hydroxychloroquine and chloroquine phosphate on March 28 to allow use of the drugs in patients who don’t qualify for clinical trials. While there is no data yet from large controlled studies, the FDA noted that it is “reasonable to believe” that these drugs could be effective, and that the potential benefit outweighs the risk.
Overall, we’re skeptical of the ability of HIV therapies to have much efficacy against the coronavirus, given data so far, and flu drug Arbidol data has been disappointing. However, flu drug Avigan data has been promising, and chloroquine-based regimens could also be effective. Among repurposed approved drugs, we’re most encouraged by the potential for IL-6 antibodies Actemra and Kevzara to help patients with severe respiratory distress. In addition, coronavirus antibodies from recovered patients could be highly effective, but difficult to scale to large numbers of patients.
Moderna Key Vaccine Player; We Still Assume 2021 Broader Availability
For Moderna’s mRNA-1273, we’re weighing strong platform technology and rapid speed of development against the fact that there are no approved RNA vaccines and manufacturing speed is uncertain. The vaccine instructs the body to make spike protein from the coronavirus, which is necessary for membrane fusion and host cell infection and is also the target for past MERS and SARS vaccine designs. The protein then creates an immune response. The first mRNA-1273 trial started in early March, with the first patient dosed as of March 16. This trial, which involves a two-shot series in healthy volunteers, should have data in three months, followed by a six- to eight-month phase 2 test in hundreds or thousands, at which point the vaccine could be produced for broader use. CEO Stephane Bancel said emergency use of the vaccine could be available for some (like healthcare workers) this fall, ahead of approval. We assume at least a year until the vaccine could become widely available, in time for a potential 2021-22 season if this coronavirus becomes seasonal. Even if data is positive later this year, manufacturing is likely to delay release. Moderna is ramping up manufacturing to allow millions of doses per month, but timelines are still vague.
Several other vaccines are moving forward. CanSino’s vaccine entered testing in China in March. Among potential large-cap pharma entrants, Johnson & Johnson has risen to the lead; it now expects to push a vaccine into development by September that could have a billion doses available around the end of the year. Moderna’s focus on mRNA is similar to approaches at peers like CureVac (entering trials in late April), BioNTech (partnered with Pfizer and entering trials in summer) and Translate Bio (partnered with Sanofi). We expect these vaccines also have potential for hundreds of millions if not a billion doses, particularly BioNTech’s and CureVac’s self-amplifying technologies. Multiple success stories would further increase global supply. We expect data in the second half of 2020 and broader availability in 2021.
Targeted Antibodies Promise Treatment and Prevention;
Assume Broad Availability by End of 2020
Several firms are working to develop antibodies in the lab that can protect patients from the virus, treat severely ill patients, or prevent ill patients from progressing to a more severe stage. Even if remdesivir fails, development of antibodies that can both treat and prevent disease could allow us to emerge from an initial shutdown with the ability to prevent future ones with pharmaceutical interventions. Dosing a small percentage of the population could prevent spread; for avian flu and Tamiflu, this was estimated at 3 million people globally. The timing of broader availability of novel, targeted antibody treatments is highly uncertain, although timelines are being accelerated for lead programs from firms like Regeneron, Vir/Biogen, and AbCellera/Lilly. Antibodies from all of these programs are moving into clinical trials by summer, and Regeneron has said hundreds of thousands of doses could be available by the end of summer. This would be enough to help healthcare workers prevent illness and perhaps start to target the high-risk population; we assume antibody manufacturing could need several months to ramp to levels sufficient for broad use. However, we think this improves prospects for stronger protection against the virus by the end of 2020, even if vaccine development is delayed well into 2021.
We Forecast 5% Hit to U.S. GDP Across All Scenarios
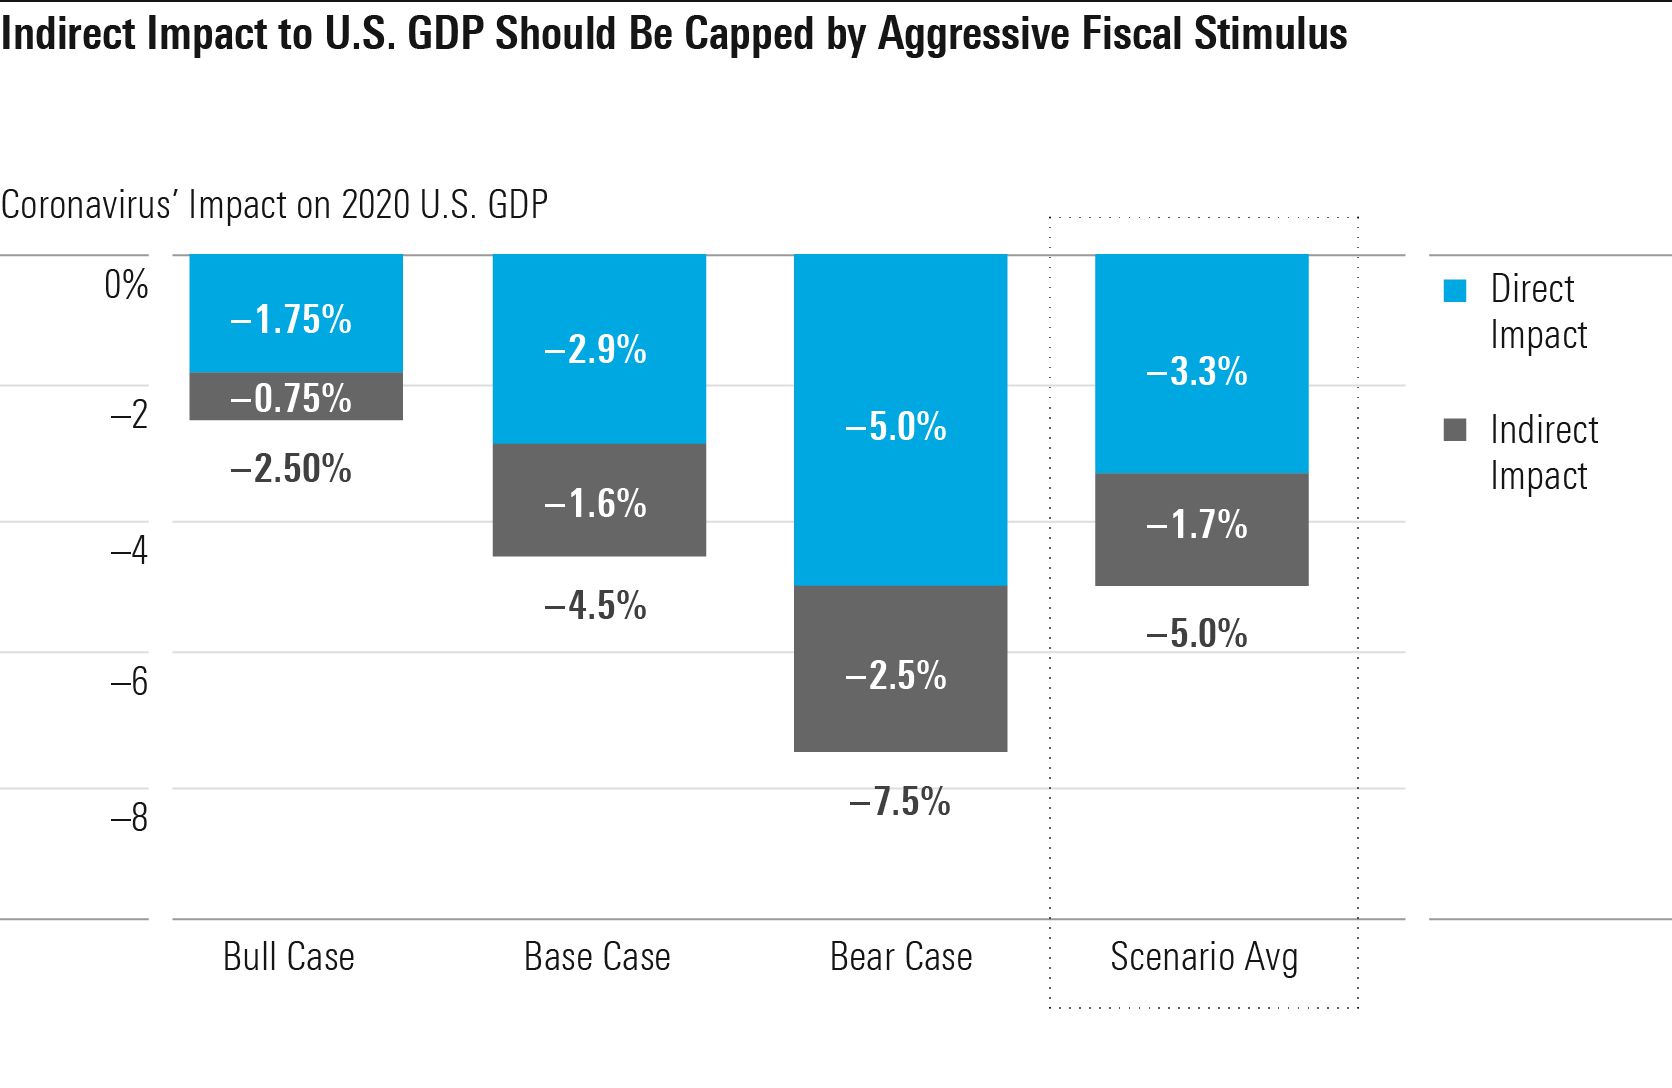
We have projected the impact of COVID-19 on U.S. GDP in 2020 in each of our three scenarios. To account for the asymmetry of risk across the scenarios, our forecast is a probability-weighted average. On average, we project a 5% hit to U.S. 2020 GDP. If we take the International Monetary Fund’s January 2020 forecast of 2.1% real GDP growth for the U.S. as our pre-COVID forecast, this results in an updated U.S. 2020 GDP growth forecast of negative 2.9%.
In terms of the rate of GDP growth itself, this 2020 forecast would surpass the 2.1% decline seen in 2009 due to the global financial crisis. We’d have to reach all the way back to the negative 11% growth posted in 1946 (due to demobilization after WWII) to find a more negative historical number. However, in terms of change in the growth rate, there are several post-WWII examples. For example, real GDP growth fell from 5.6% in 1973 to negative 0.5% in 1974, a greater deceleration (over 600 basis points) than we expect in 2020.
We think the larger driver of GDP impact will be the “direct” impact from COVID-19, mainly including business closures and voluntary social distancing. In economic terminology, the direct impact is more of a supply-side impact, by reducing the economy’s overall productivity capacity. The direct impact accounts for 330 basis points of GDP impact across our scenarios.
On the other hand, we think the indirect impact will be just 170 basis points thanks to the aggressive fiscal and monetary policy being deployed, which should prop up aggregate demand in the U.S. economy, offsetting lost spending power among unemployed as well as lower economic confidence.
There’s only so much that countercyclical economic policy can do, though. Unless these policies somehow help workers and capital in temporarily affected industries like retail, restaurants, and hotels redeploy to other industries (not likely), there is little hope of preventing some sort of direct economic impact from COVID-19. However, these policies play a crucial role in limiting the economic damage and minimizing the risk of a worst-case, Great Depression-style scenario.
Our base-case forecast for U.S. GDP impact is driven by an industry-level buildup. We divide the impact into the direct impact from COVID-19 (business closures, lower demand due to voluntary social distancing) and indirect impact (lower demand from the overall fall in economic activity).
The 2020 impact to some industries will be severe. We expect widespread closures of schools and nonessential businesses through the second quarter, with restrictions tapering off after that. However, we think many investors are getting caught up in the headlines of temporary business closures and erasure of demand for certain industries. We see little scope for COVID-19 itself to shut down the bulk of the U.S. economy.
State Shutdown Orders Exempt Most of the Economy
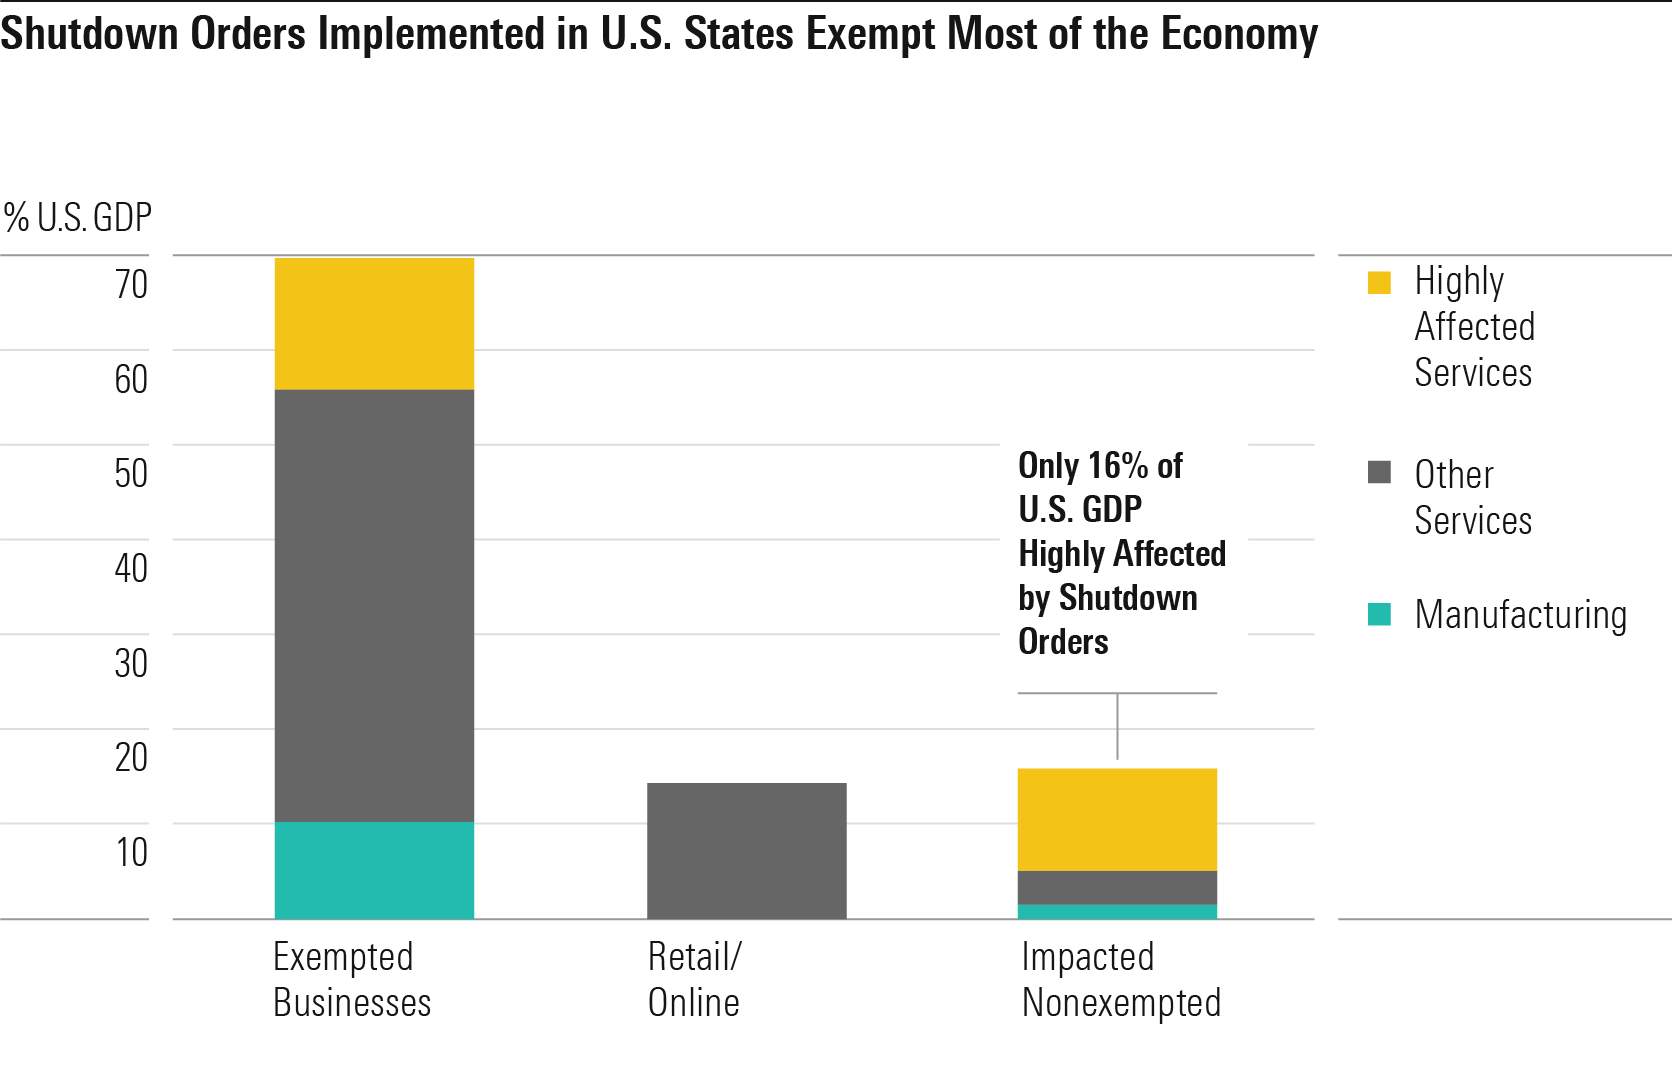
Since March 19, 28 U.S. states (covering 60% of the U.S. population) have announced stay-at-home orders of some form, often referred to as lockdowns in the media. Most of the orders stipulate at least a two-week duration. Most substantively, these orders mandate the shutdown of all nonessential businesses, sparking fears of a sharp crash to economic activity. However, we think the economic impact of the orders is probably exaggerated. We estimate that only 16% of U.S. GDP will be affected by these orders, even if implemented in all 50 U.S. states.
The definition of essential businesses has cast a wide net in most states’ orders, covering about 70% of U.S. GDP, by our estimates. Large industries such as agriculture, utilities, construction, logistics, healthcare, public services, and much of manufacturing have been exempted as essential businesses. Many otherwise nonessential businesses that are key suppliers for essential businesses are also exempt. Many companies remain unclear on their exemption status; however, we expect exemptions to be progressively widened as the spread of COVID-19 decelerates and industry pressure increases.
We think the wide availability of shutdown exemptions makes sense. The businesses that have been uniformly nonexempted (such as restaurants, hotels, offices, retail, gyms, and salons) have a relatively high ratio of social interactions per unit of GDP. This means that we can cut down on social interactions drastically without having to cut GDP proportionately. The remaining businesses have a lower ratio of social interactions to GDP. They can be shut down should current methods fail, which we do not expect in our base case. Finally, out of the 30% of businesses that remain nonexempted, we think nearly half can maintain operations on a remote or online basis. Any workers required to be on-premises to support these businesses (such as those needed to maintain IT systems) are generally allowed to do so.
Manufacturing and Services Hit About Equally
In recent U.S. recessions, we’ve been used to seeing the manufacturing sector take a much bigger hit than the overall economy. From 2007 to 2009, manufacturing growth slowed by over 1,200 basis points, almost tripling the 420-basis-point slowdown in GDP overall. Similarly, the 2001 recession saw manufacturing take a disproportionate hit.
We forecast that the 2020 coronavirus slowdown will break that pattern and instead be driven about equally by manufacturing and services. This is because the direct hit from the virus will fall primarily on the services sector, which will see much of its activity cut back for social distancing purposes. The private services sector accounts for around three fourths of U.S. GDP now. However, analysts shouldn’t conflate the highly visible, most affected services (restaurants, retail, hotels, and so on) with the entire U.S. services sector. For example, information services accounts for 5% of U.S. GDP, and we expect minimal direct impact to that industry.
We still think manufacturing will take a large hit in 2020 due to the indirect impact of COVID-19 on overall economic activity. Consumers tend to reduce their purchases of durable goods more than other types of expenditures during a recession, and durable goods have a much higher manufacturing intensity than other forms of consumption. We don’t expect factory shutdowns to cause a large direct impact on manufacturing. Manufacturing has been largely exempted from government-mandated shutdowns. The voluntary shutdowns we’ve seen have largely been confined to autos. Moreover, we think the loss in 2020 U.S. auto production due to shutdowns probably won’t be greater than the loss in demand that automakers are likely to face anyway (for reference, auto sales fell 18% in 2008).
Services With High Social Interaction Will Be Hardest-Hit
Overall, we see the highest impact of COVID-19 on services industries that will need to be curtailed for social distancing and reduction of social connectivity, namely air travel, hotels, restaurants, and arts and entertainment. In our base-case U.S. timeline, we think the majority of individuals and businesses will strive to avoid travel for nearly the rest of 2020. Also, over 75% of large events will be canceled through the end of 2020.
We forecast about a 35% impact to air travel and a 37% impact to hotels, given the widespread curtailment of travel. U.S. flight cancellations already reached 29% in mid-March, and U.S. revenue per available room fell 33% the second week of March. Arts and entertainment will be hit hardest as it focuses overwhelmingly on large events such as concerts and sporting events.
At first glance, transportation might seem in for a precipitous drop, given our expectations for curtailed travel. However, passenger transportation (via air and ground) counts for only 26% of transportation sector GDP. The remainder (74%) is freight transport, which will see some indirect impact from the general decline in economic activity but no direct impact from COVID-19 itself.
We project a 18% impact to restaurants (including bars) in 2020, with quick-service restaurants being hit in the upper single digits but dine-in restaurants plus bars being hit on the order of 30%. Restaurant closures (excluding takeout) should cover most of the U.S. in the second quarter, but we think closures will range from 0% to 50% of the U.S. for the second half of the year. We don’t think takeout/drive-thru service will be subject to government shutdowns. However, people are likely to curtail their use of restaurants to some degree even when not subject to government shutdown, due to voluntary social distancing.
Retail Decline in 2020 Similar to Run-of-the-Mill Recession
We project an 11% hit to total U.S. retail sales in 2020 in our base case as a result of COVID-19. Assuming sales would’ve grown 3% in the absence of COVID-19, this translates to an 8% drop in 2020 U.S. retail sales versus 2019 levels, in line with the 8% drop in 2009 after the global financial crisis.
We don’t think 2020 will be catastrophic for retail as a whole. Only 37% of U.S. retail sales fall into the nonessential business category subject to state shutdown orders. Irrespective of shutdown orders, U.S. consumers will curb their shopping visits to practice voluntary social distancing. However, we think many consumers will readily switch to online channels to make up for lost in-store purchases, leading to a 1% positive impact on nonstore retail sales in 2020. Most of the nonessential store categories are ripe for temporary substitution to e-commerce. Motor vehicles are the obvious exception (with e-commerce penetration unlikely to jump overnight), but a large drop in vehicle sales is typical for a U.S. recession.
We expect nonessential store closures to average over 75% implementation in the second quarter, but in the second half of 2020, we expect mostly 25%-50% implementation on average (likely fluctuating depending on outbreak severity). This would give consumers a window for catch-up purchases.
Adjusting for falling gas prices, we forecast a 9% base-case impact to retail sales, which is how we derive our 9% impact to retail sector GDP.
We Don’t Expect a U.S. Housing Crash as a Result of COVID-19
While memories of the 2008 housing bust linger, we don’t expect a crash in the U.S. housing sector as a result of COVID-19. We expect a 5% decline in residential construction in 2020 with a commensurate 5% drop in housing starts (a 6% decline in single family and a 2% decline in multifamily). Though order cancellations and fewer new orders will push starts lower, we see little reason for construction activity to grind to a halt. Construction has nearly universally been exempted from government shutdown orders, and the impact of sick workers is minimal in our base case. We expect a rebound in housing demand in the second half of 2020, particularly as households respond to lower mortgage rates.
By historical standards, housing investment hardly looks in excess, with residential fixed investment at 3.7% of GDP in 2019, under the post-WWII average of about 4.5%. Our long-term outlook for housing remains bright, as we see housing starts reaching over 1.4 million units by the mid-2020s, up from about 1.3 million units in 2019. Our positive outlook is driven by two key factors: more household formations among the working-age population and population growth. Once the nation moves past COVID-19, the portion of adults age 45 and younger who head a household should climb over the subsequent five years as economic conditions and credit scores improve. Nevertheless, we still expect the headship rate (the share of the population who are head of households) to fall short of levels seen before the global financial crisis, when lending standards were too relaxed. Our forecast also assumes mild population growth, based on both census-forecast fertility rates and our internal immigration forecast. Immigration is poised to fall short of historical norms, with heightened restrictions on illegal overland immigration and legal immigration from the Middle East.
Likewise, nonresidential construction doesn’t look to be in excess, with nonresidential investment in structures at 3% of GDP in 2019 (versus the post-WWII average of 3.4%). Overall, we expect a 5% impact to construction sector real GDP in 2020, with an 8% impact to the residential sector (our post-COVID forecast of 5% residential decline less our pre-COVID forecast of 3% growth) plus a 3% impact to nonresidential construction.
Employment Will Be Hit Hard, Underlining Need to Shore Up Demand
The hardest-hit sectors (mining, retail, transportation, arts and entertainment, hotels and restaurants, and miscellaneous services) account for just over 15% of GDP but nearly 30% of U.S. employment. As such, the direct impact on employment from COVID-19 could be much greater than the direct impact on GDP. In our base case, these highly affected sectors drive 270 basis points of our total U.S. GDP impact of 450 basis points. However, if we assume that employment within each sector falls in proportion to sector GDP, then these sectors alone could drive almost 500 basis points of lower U.S. employment, which would push the U.S. unemployment rate from 3.5% as of February 2020 to roughly 8.5%. In the second quarter, when business closures peak, the impact could be even worse.
However, we see little difficulty in these workers returning to work once business closures and outbreak severity subside in the second half of 2020. This is a marked contrast with the aftermath of 2008, when massive numbers of workers in boom sectors like construction and real estate needed to be reallocated to new sectors (and in many cases to new cities and states), a process that took many years to accomplish.
U.S. on Track to Deliver Historically Strong Fiscal Policy Response
The likely severe hit to employment that we’ve outlined underlines the need for strong countercyclical economic policy to boost aggregate demand, as laid-off workers are likely to severely curb their expenditures. We think U.S. fiscal and monetary policy is up to the task.
The U.S. has responded to surging economic pressures from COVID-19 with fiscal stimulus of herculean strength. On March 27, Trump signed a stimulus bill of more than $2 trillion--about 10% of U.S. 2019 GDP. If the entire $2 trillion stimulus were added to the U.S. 2020 budget, it would add 1,000 basis points to the U.S.’s deficit/GDP ratio. It’s unlikely that all of the stimulus funds will be claimed and disbursed in 2020. Still, we feel comfortable penciling in a 1,000-basis-point impact to the deficit from federal stimulus in 2020 overall. We think there’s a fair chance that Congress will approve another large stimulus bill in 2020. This is because the March 27 stimulus bill signifies a colossal political shift, in our view--a development that news coverage has glossed over.
In the Great Recession aftermath of the 2010s, the primary obstacle to incremental fiscal stimulus was staunch Republican congressional opposition (ostensibly due to ideological commitments to less government invention in the economy). Now, the Trump-led GOP has emerged as a champion of fiscal stimulus. Combined with a Democratic party that retains its economic interventionist leanings, we see little reason why the U.S. won’t do “whatever it takes” to prop up aggregate demand in 2020.
Combining our estimate of 1,000 basis points of direct stimulus with about 200 basis points of contribution from automatic stabilizers (for example, a reduction in taxation as income falls due to progressive tax rates), we forecast a 2020 U.S. federal deficit/GDP ratio of 17%, up 1,200 basis points from 2019. This fiscal intervention dwarfs anything seen in the U.S. since WWII. It’s far greater than the post-Great Recession stimulus as well as the New Deal-era budget deficits.
We also think the Federal Reserve has acted impressively quickly so far. Beyond the 50-basis-point cut in interest rates to effectively zero on March 15, the Fed has deployed an array of heavy weaponry not seen since the global financial crisis, including facilities to support liquidity in the commercial paper and money markets. Given the zero lower bound on interest rates, Fed support is necessary but not sufficient to keep the economy afloat in the face of severe pressures on aggregate demand; thus the need for fiscal stimulus. For now, the Fed is amply fulfilling its role.
We Still Forecast a Muted Long-Run Global GDP Impact
We expect world real GDP to fall 1.4% in 2020, marking a 460-basis point reduction from our pre-COVID expectation of 3.2% growth (derived from the IMF’s January 2020 forecast). This is worse than the approximate 0% global GDP growth we saw at the 2009 nadir. However, the 2009 slowdown started from a higher base (5.6% real GDP growth in 2007), meaning the deceleration in growth rates was slightly greater than we expect for COVID-19 in 2020.
We use our detailed U.S. forecast as a benchmark for other global economies while adjusting for factors likely to push other countries above or below the U.S. level of impact (500 basis points in 2020). We expect the average country to be hit nearly as hard as the U.S. (460 basis points for the world average).
We think Europe will surpass the U.S. in GDP impact. Currently, Europe surpasses the U.S. in COVID-19 outbreak severity, with roughly 30,000 deaths versus 4,000 in the U.S. More important, we see risk that countercyclical measures in Europe are inadequate, thanks to political problems.
Meanwhile, we think Japan and other advanced economies (including South Korea, Singapore, and Taiwan) will see just a 2% hit to growth. These countries have been generally very adept in their response to COVID-19, allowing them to eschew the curtailment of economic activity that we’re likely to see in the U.S. and Europe.
In our previous report, we argued that COVID-19 would have a minimal impact on long-run GDP growth for most countries. We argued that most factors by which the COVID-19 epidemic would drag on the economy in the short run--such as business closures, sick workers, and loss of economic confidence--didn’t make sense as drivers of long-run economic impact.
We acknowledged that the experience of the sluggish post-2008 recovery creates some uncertainty about whether the economy could experience a V-shaped recovery, as implied by minimal long-run impact. However, we pointed out that many historical recessions have not been like 2008 in terms of creating a long-lasting negative impact on GDP. And the analogy to 2008 doesn’t hold well for a COVID-19 recession, either. A recovery from a recession induced by COVID-19 will not require massive reallocation of workers and capital to new sectors and modes of economic activity. By contrast, the post-2008 U.S. housing bust required massive reallocation of labor away from construction and real estate into other sectors. Unemployed workers in these sectors took many years to regain employment. Finally, we saw little reason that economic confidence wouldn’t quickly surge back to normal once the outbreak subsides, in contrast to the uncertainty that lingered after the 2008 global financial crisis.
Overall, we believe these arguments are still just as valid today. However, given the magnitude of the recession we face in 2020, we have notched up our estimates of the long-run global economic impact from COVID-19. We had previously set long-run impact as the sum of fatalities/working population plus 10% times the impact to 2020 GDP. We’re now increasing that latter coefficient to 15% in our base and bull cases and 20% in the bear case. This reflects an increased chance that a GDP growth slowdown in 2020 has longer-run economic consequences.
This results in a new long-run impact forecast of negative 0.9% for both U.S. and global GDP, up from our prior estimate of negative 0.3%. To be clear, our projection of negative 0.9% long-run impact should be applied to the long-run level of GDP, not the long-run GDP growth rate. Global equities are still down around 20% from pre-outbreak levels; as such, we think markets are still vastly overreacting to the global economic impact of COVID-19.
Arguably, the biggest worry surrounding our forecasts for modest long-run impact was that COVID-19 would trigger a downward spiral in aggregate demand. However, the historically large fiscal stimulus passed by the U.S. on March 27 goes a long way toward assuaging our concerns.